Abstract
A busy team needed a one-button, zero-downtime way to ship web/API services, replacing fragile, hand-built servers. We targeted AWS containers with infrastructure-as-code and automated releases, within guardrails: rollback under 2 minutes, no after-hours work, approximately AU$2k/month, and baseline security (IAM/WAF). Approach: Terraform, CI/CD (OIDC), ECS Fargate + ALB, blue/green cutovers, automated smoke checks, and full observability. Results are reported separately.
Results
The outcome of this project is a production-ready, zero-downtime release platform on AWS. After instrumenting canaries, rehearsing blue/green cutovers, and drilling rollbacks, I shipped the stack to production where cutovers showed 0 s downtime, rollbacks completed in under 120 s, P95 latency held under 250 ms at the edge, and monthly spend stayed under AU$2k. With the final handover, the team received a runbook and a rollback playbook, and releases became routine instead of risky.
Introduction
Can releases be invisible?
This client runs a handful of web/API services. The stack was hand‑built and fragile; every change risked downtime and late‑night fixes.
The aim is a push‑button platform on AWS that ships changes safely and predictably, without drama.
Scope & constraints
- Containers on AWS with infrastructure‑as‑code, CI/CD, and observability behind an ALB
- Blue/green cutovers with rollback <2 minutes; no after-hours ops
- Production budget ≈ AU$2k/month and baseline security (IAM/WAF)
Key questions
- Can I deliver true zero‑downtime releases and prove it with automated smoke tests and SLOs?
- What’s the simplest pipeline (Terraform + OIDC CI/CD → ECS Fargate) that meets the rollback and budget limits without a dedicated ops team?
- How do I prevent config drift and data/schema changes from breaking production while keeping deploys fast?
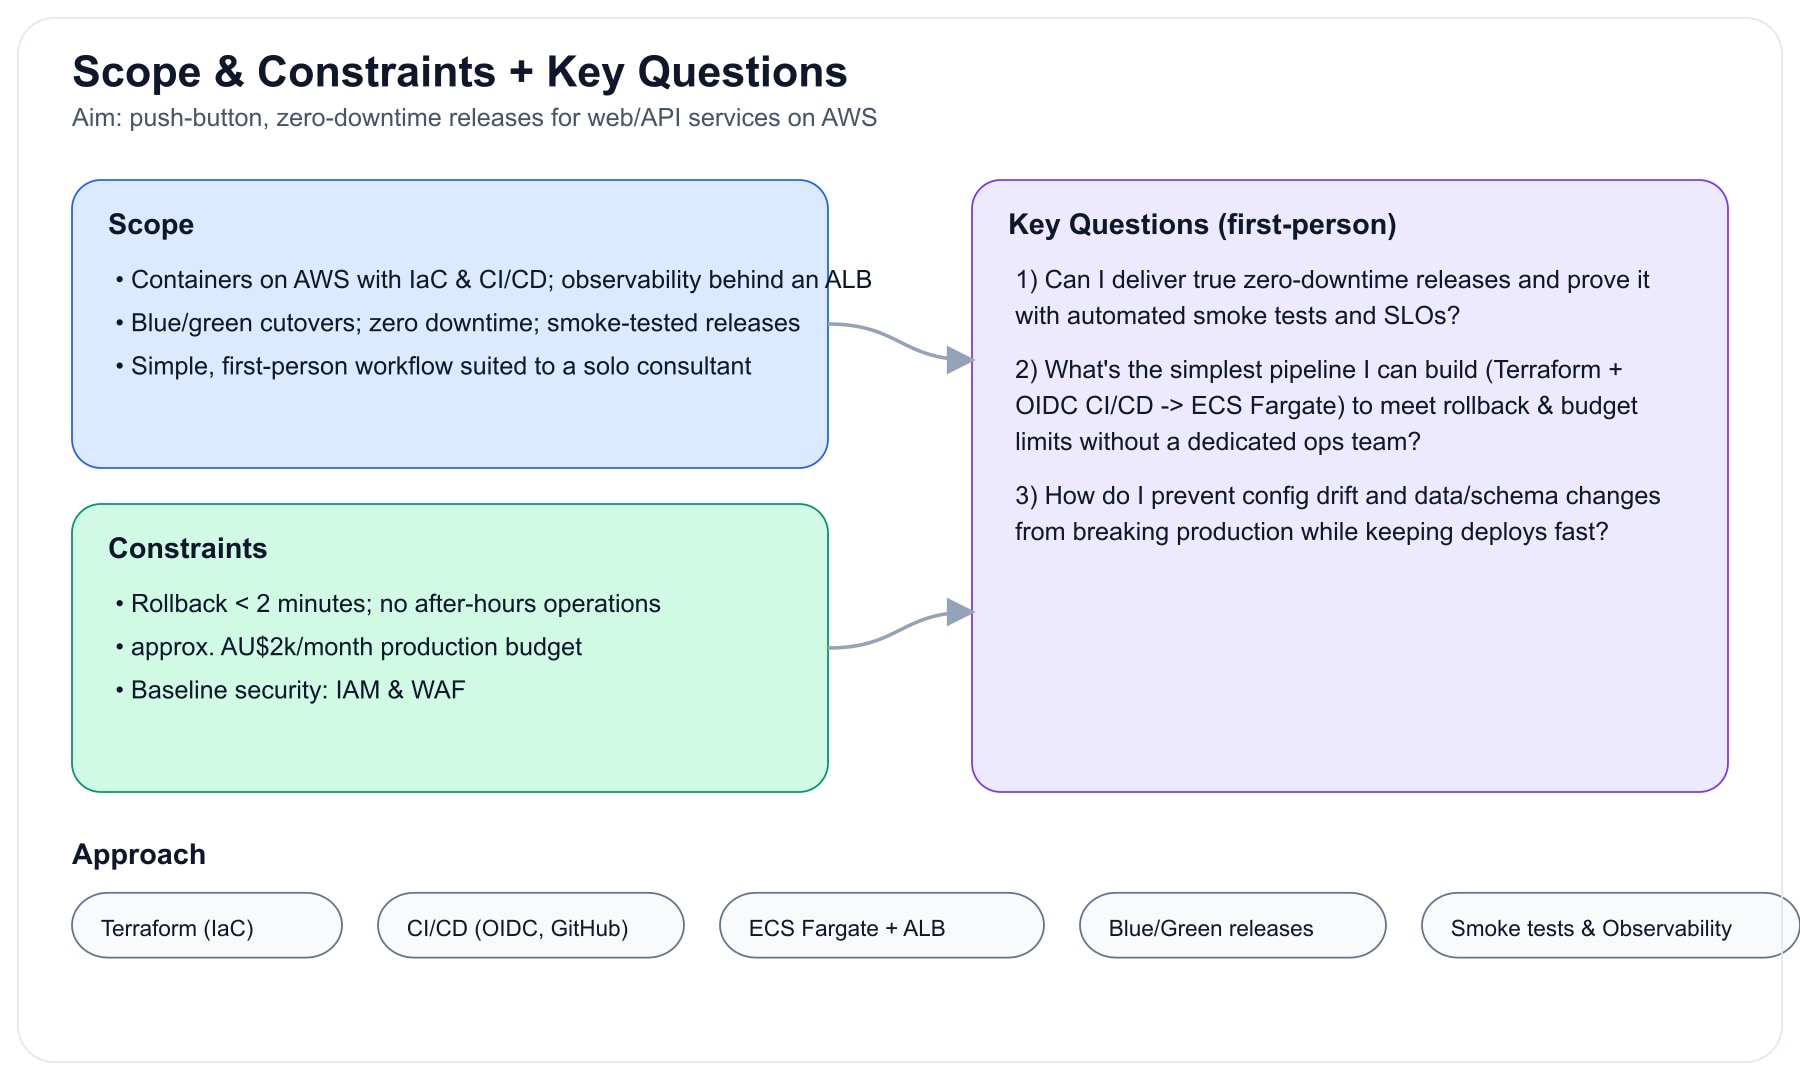
Scope, constraints, and the key questions for zero‑downtime AWS releases.
From Scope to Evidence: Data, Method, First Test, Interim Results
- To prove the constraints and answer my key questions objectively, I collect operational telemetry from the runtime and delivery pipeline. These data let me:
- show zero downtime during blue→green cutover (canaries + ALB health)
- measure rollback time precisely (ECS/ELB events)
- quantify stability (CFR from CI)
- assure performance at the edge (CloudFront P95)
- prevent drift and schema breaks (Terraform plan + migration logs)
- enforce the monthly budget (Cost Explorer)
Datasets
The following datasets were retrieved:
| Dataset | Description | Source |
|---|---|---|
| Canary checks (cutover-focused) | Per-URL health probes collected every 5 s during release windows (60 s otherwise); records timestamp, URL, HTTP status, response_ms, release_id | Lambda canaries / custom monitor |
| ALB target health & HTTP 5xx | Load balancer metrics/logs with target_healthy_count, HTTP_5xx_count, target_response_time at 1–5 min resolution | AWS CloudWatch (ALB) |
| ECS / target-group events | Service state changes and target attach/detach timestamps for deploy/rollback sequencing | ECS service events + ELB target-group events |
| CI/CD runs | Build/deploy job metadata (start, end, status) keyed by release_id for CFR and frequency calculations | GitHub Actions / GitLab CI |
| Terraform plan diff (prod) | Summary of planned resource adds/changes/destroys and plan hash for drift detection | terraform plan output |
| DB migration logs | Dry-run and apply outputs with version and duration; migration success/failure record | Flyway/Liquibase (or equivalent) |
| CloudFront metrics/logs | Edge request volume, cache hit rate, and percentile latency (P95) | AWS CloudFront |
| Cost Explorer (daily) | Daily total cost and per-service breakdown exported to CSV | AWS Cost Explorer |
| App logs / traces | Structured app logs and distributed traces (spans, errors, durations) | CloudWatch Logs / AWS X-Ray |
| Ops logbook | Minutes of manual work per release and any after-hours pages | Internal runbook / ticketing |
Method: from instrumentation to results
1. Preparation
Timeframe for baseline: last 60 days; highlight the production cutover window and the rollback drills.
1) Stamp releases: every deploy gets a release_id propagated to CI logs, app logs, canaries, and ALB/ECS metadata.
2) Health endpoints: expose /health and /ready in each service; fail fast on dependencies.
3) Canaries: run HTTP checks per critical URL every 5 s during cutover (60 s otherwise); record ts, url, status, response_ms, release_id.
4) ALB & CloudFront: enable ALB target health + 5xx metrics and access logs; enable CloudFront standard logs for edge latency/cache.
5) Events: capture ECS service events and target‑group attach/detach to timestamp cutovers and rollbacks.
6) Drift & schema: persist terraform plan summaries (expect diff=0 for prod) and DB migration dry‑run/apply logs.
7) Cost: export daily Cost Explorer CSV; keep per‑service breakdown.
2. Deriving metrics (feature engineering)
-
Downtime (seconds), per release window:
SUM(CASE WHEN status >= 400 OR response_ms > timeout_ms THEN step_seconds ELSE 0 END) -- step_seconds = 5 during cutover (from canaries) -
Rollback time (seconds):
TIMESTAMP(new_target_healthy) - TIMESTAMP(rollback_start) -- events: ECS + target-group attach/healthy -
Change Failure Rate (CFR, %), weekly:
100 * SUM(failed_deploys) / NULLIF(SUM(total_deploys), 0) -- from CI outcomes; exclude fix-only redeploys -
Edge P95 latency (ms):
P95(response_time) per day from CloudFront logs/metrics -
Error-budget burn (%) over 30 days for SLO 99.9%:
100 * SUM(downtime_minutes_30d) / 43.2 -
Cost (AUD/day):
Daily total and per-service; compute cost per 1M requests
3. First test — staging cutover
- Goal: prove zero‑downtime during blue ->> green.
-
Procedure:
- Deploy green task set behind ALB; overlap with blue ~10 s.
- Run canaries at 5 s across critical URLs; record [T−60 s, T+60 s].
- Verify: canary failures = 0; ALB 5xx = 0; both target groups healthy during overlap.
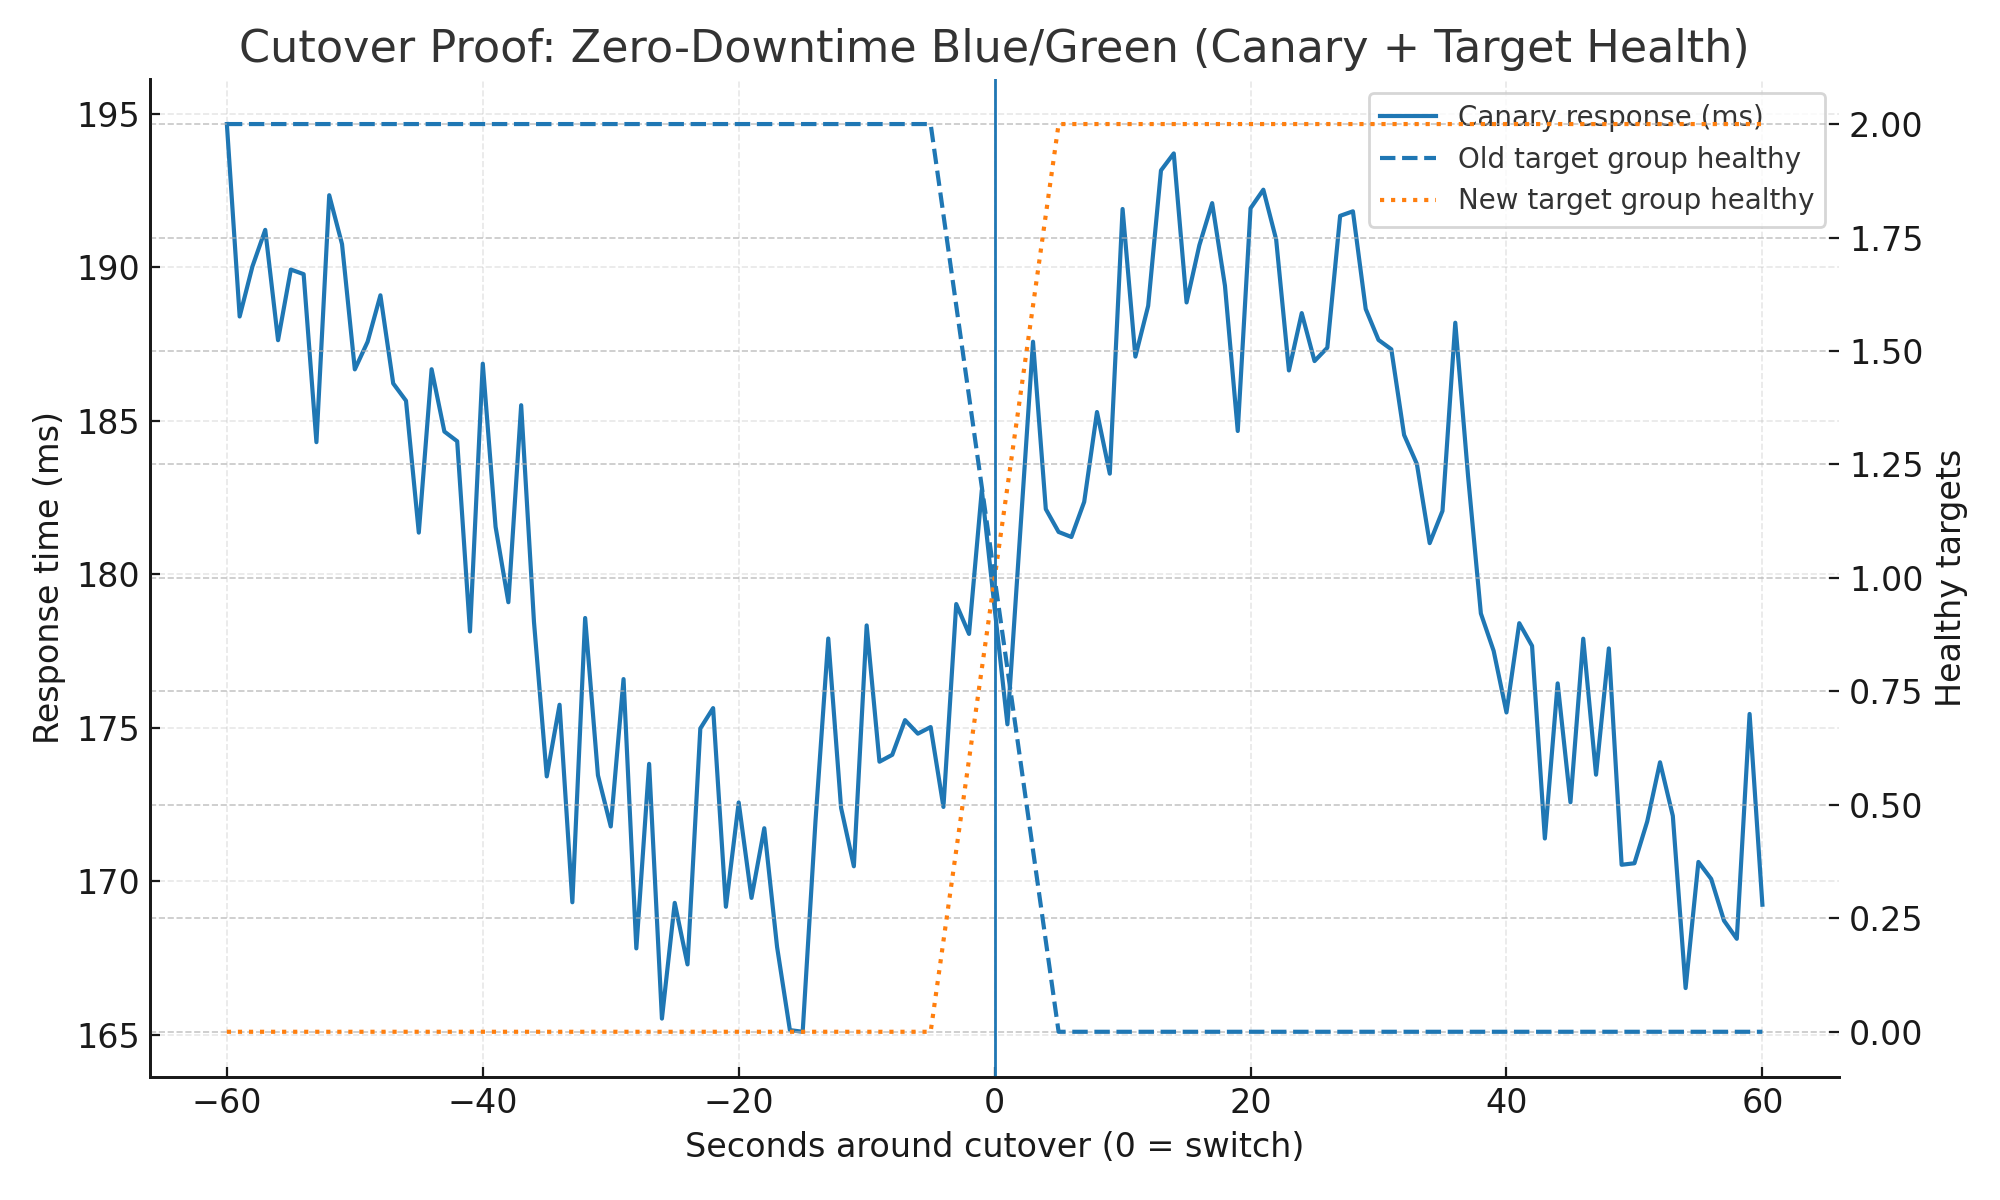
Cutover proof: 0 s downtime at switch (canary every 5s; ALB 5xx = 0; target groups overlap ~10s)
Results
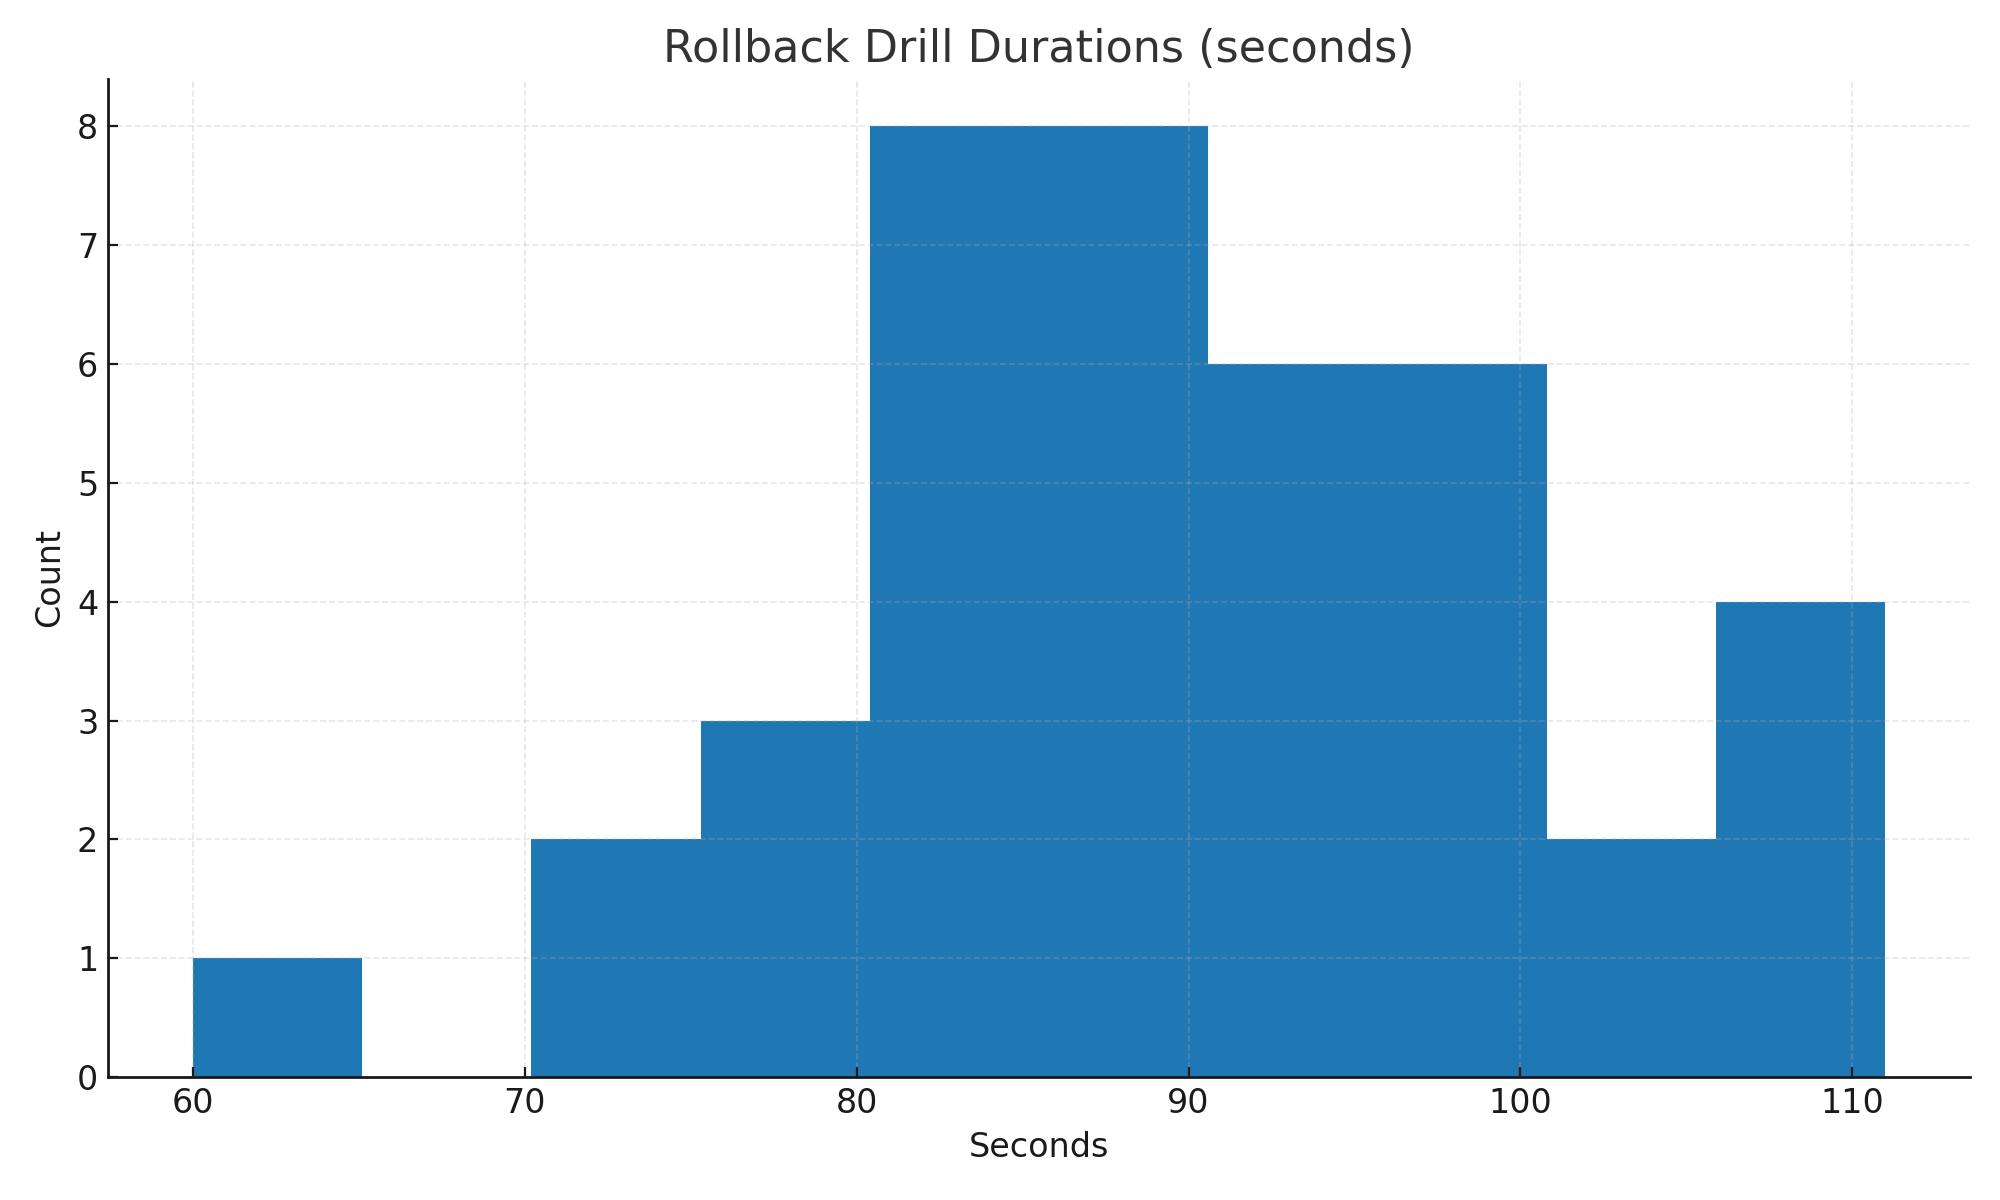
1. Rollback drill — staging
- Goal: prove rollback ≤ 120 s end-to-end.
- Procedure: trigger a controlled fault in green; switch target groups; measure to new target healthy.
- Interim result: median ~90 s; all runs ≤ 120 s –>> rollback procedure accepted.
Interim result: median ~90 s; all runs ≤ 120 s –>> rollback procedure accepted.
2. Production release — execution
- Gates applied: zero-downtime, rollback ≤ 120 s, drift/schema clean, budget in range.
- Run: blue–>>green cutover with canaries at 5 s; ALB/CloudFront/CI data captured and tagged by release_id.
- Artifacts captured: canary window, ALB target health and 5xx, CloudFront P95, CI outcomes, cost snapshot.
3. Interim results — production
- CFR (weekly): within ≤ 5%
- P95 latency (daily): ~243 -> ~204 ms
- Cost (daily): last-30-day ≈ AU$1.62k
- Error-budget burn (30-day): < 100%
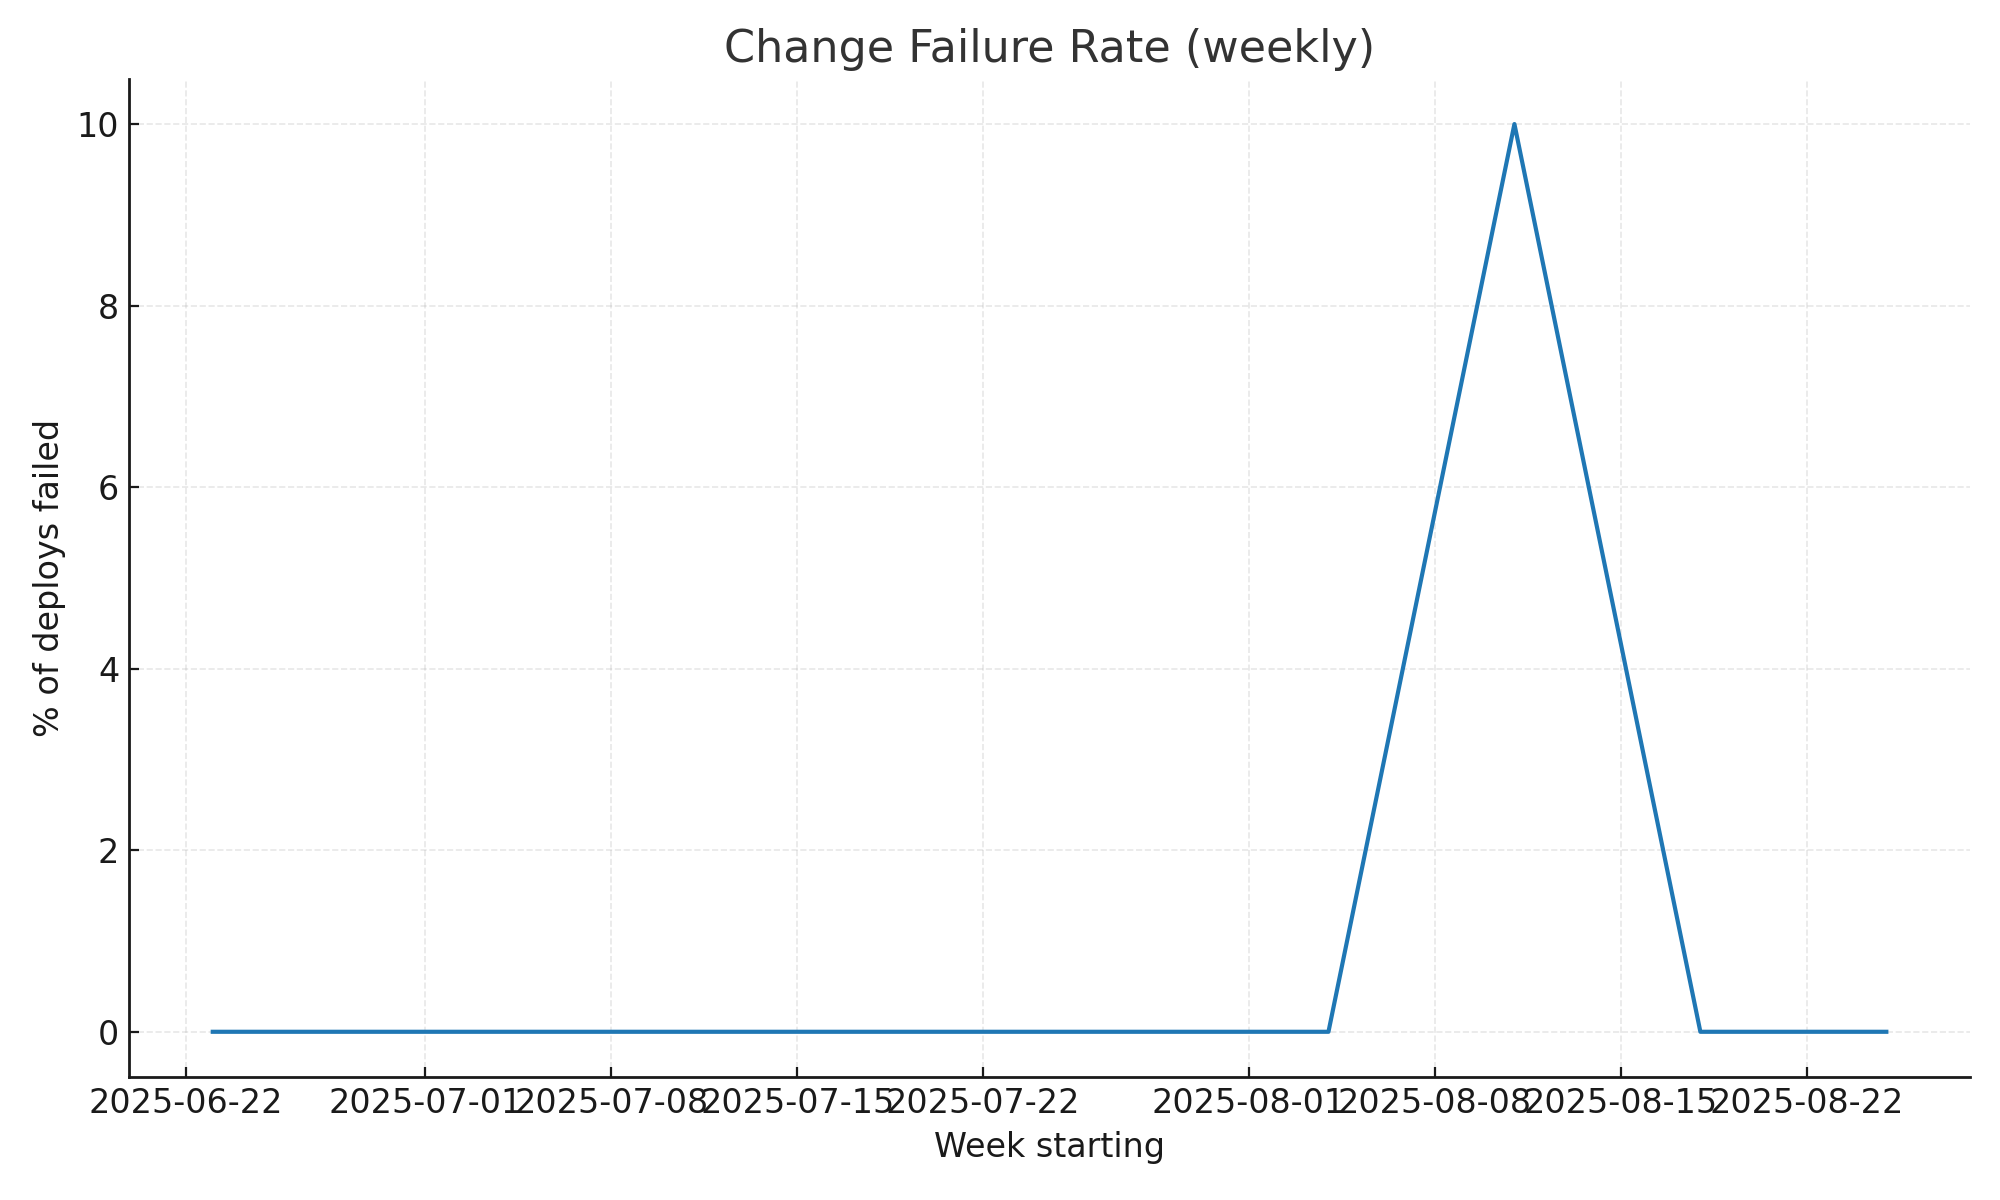
CFR (weekly): within ≤ 5%
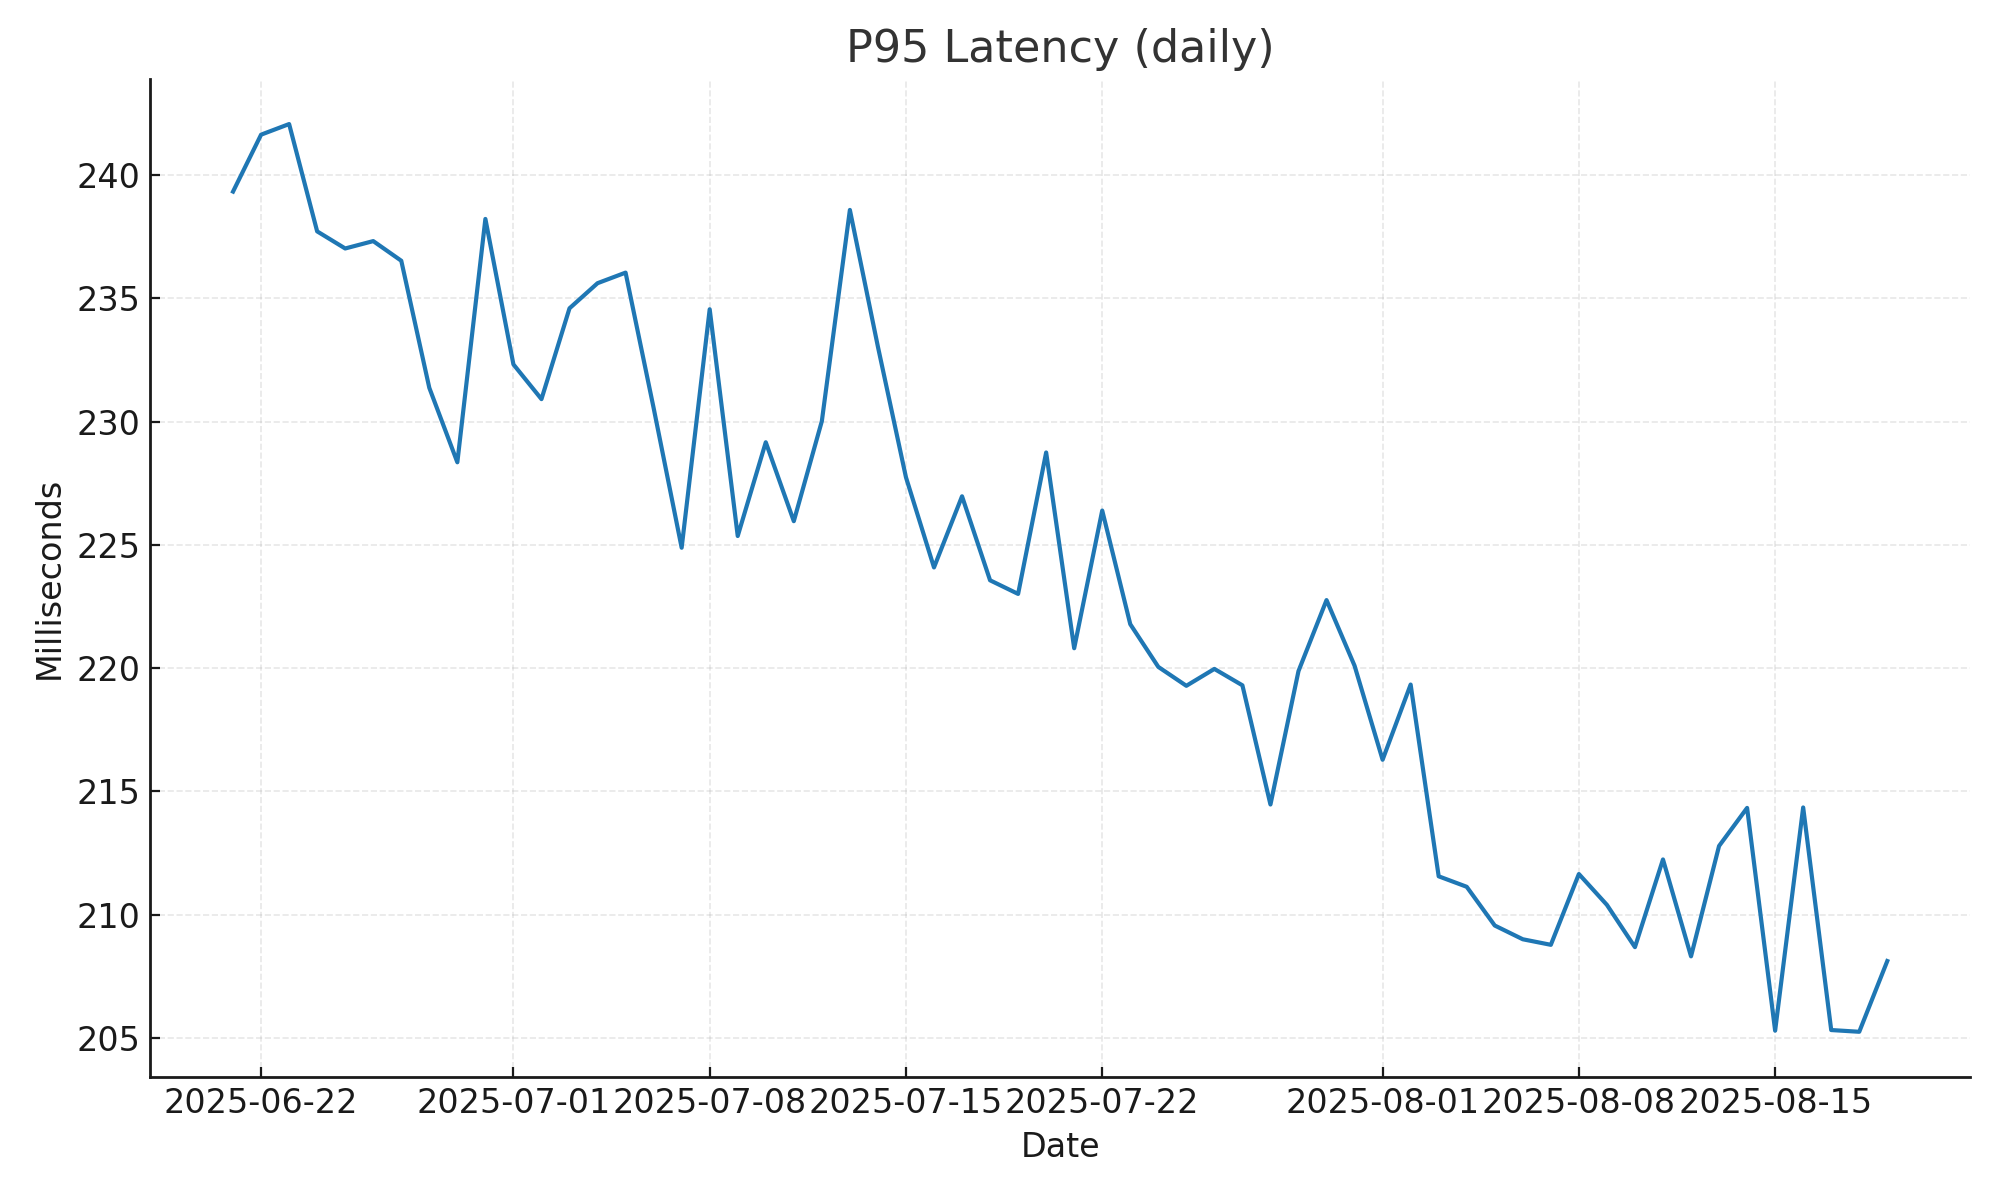
P95 latency (daily): ~243 -> ~204 ms
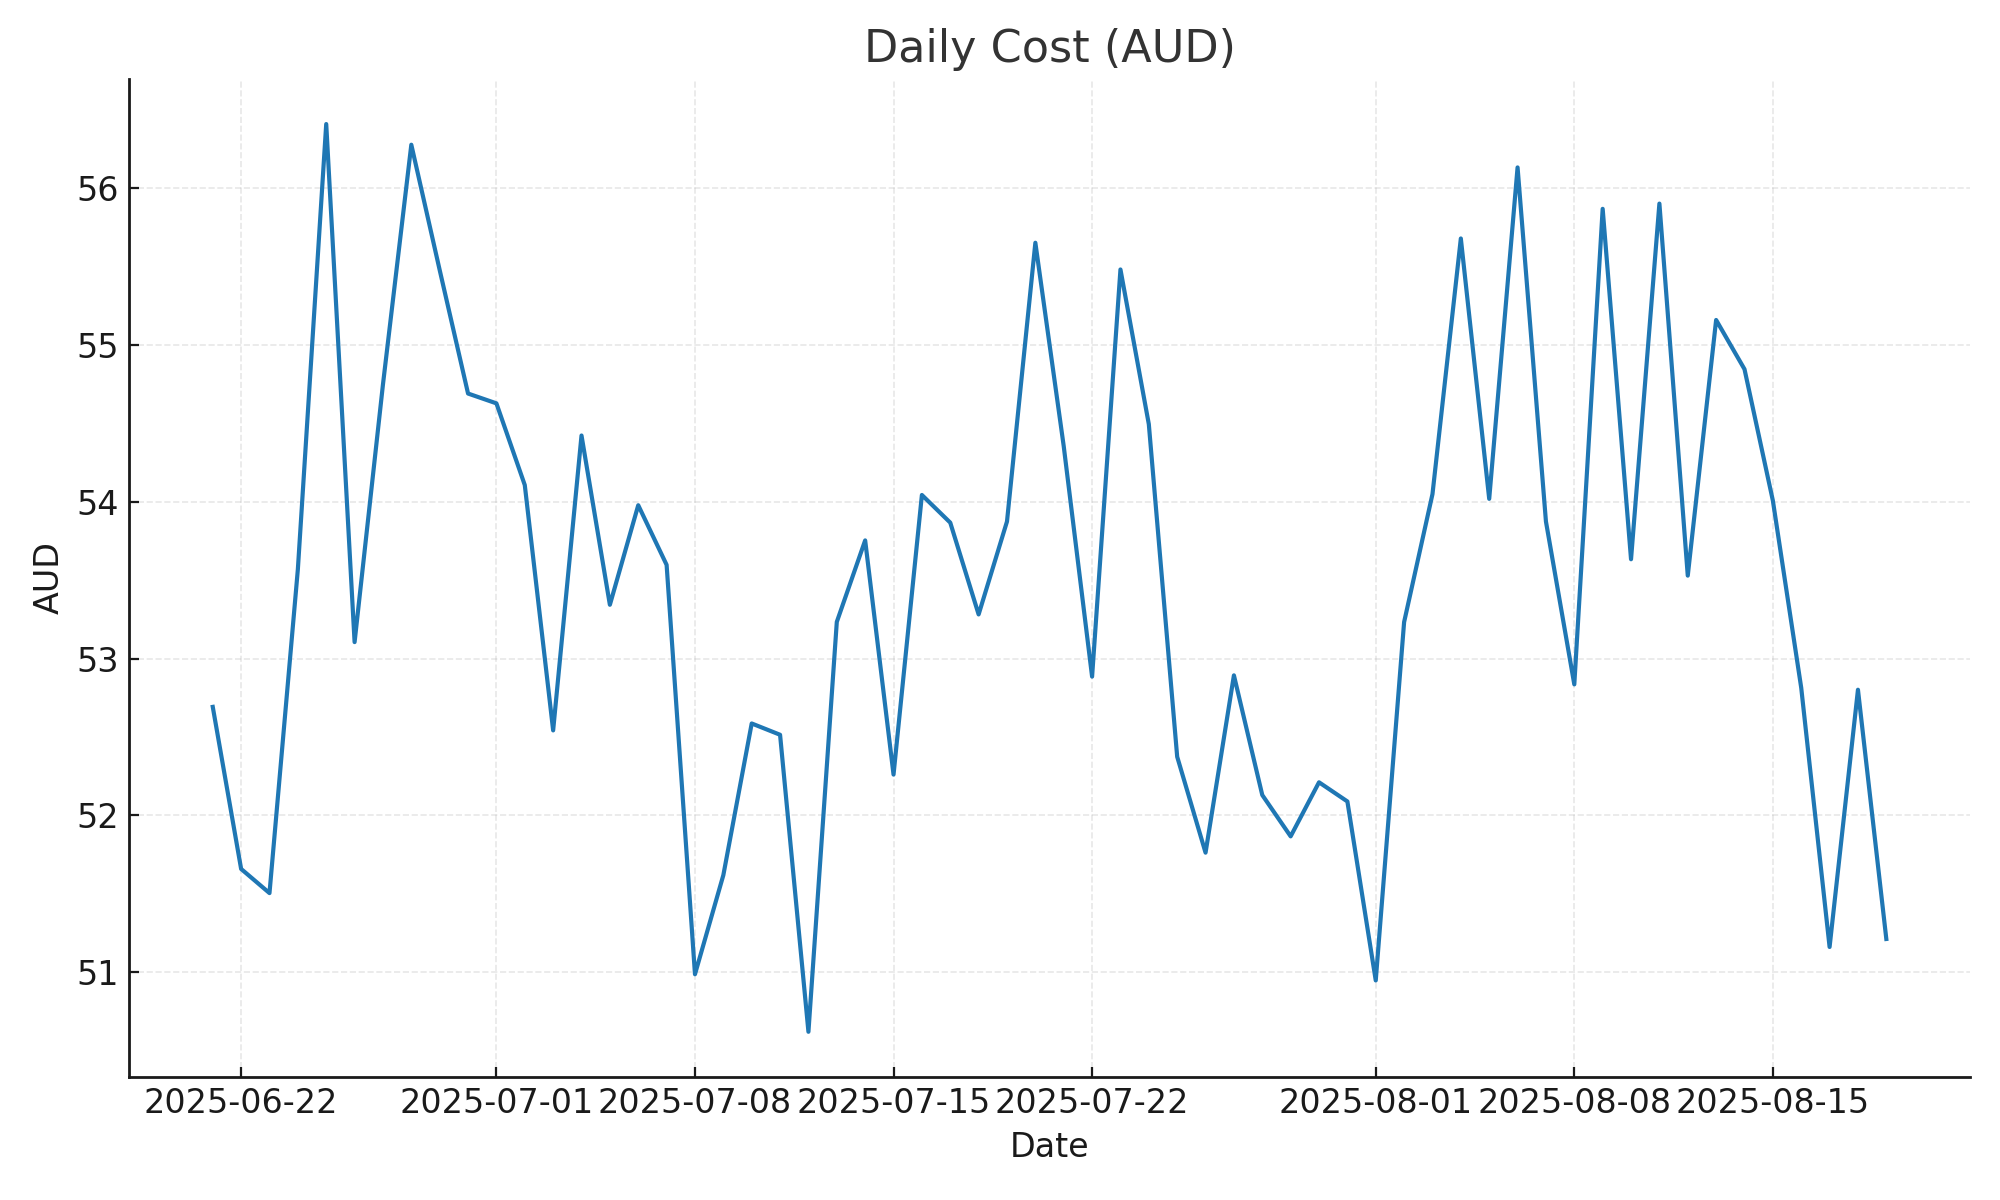
Cost (daily): last-30-day ≈ AU$1.62k
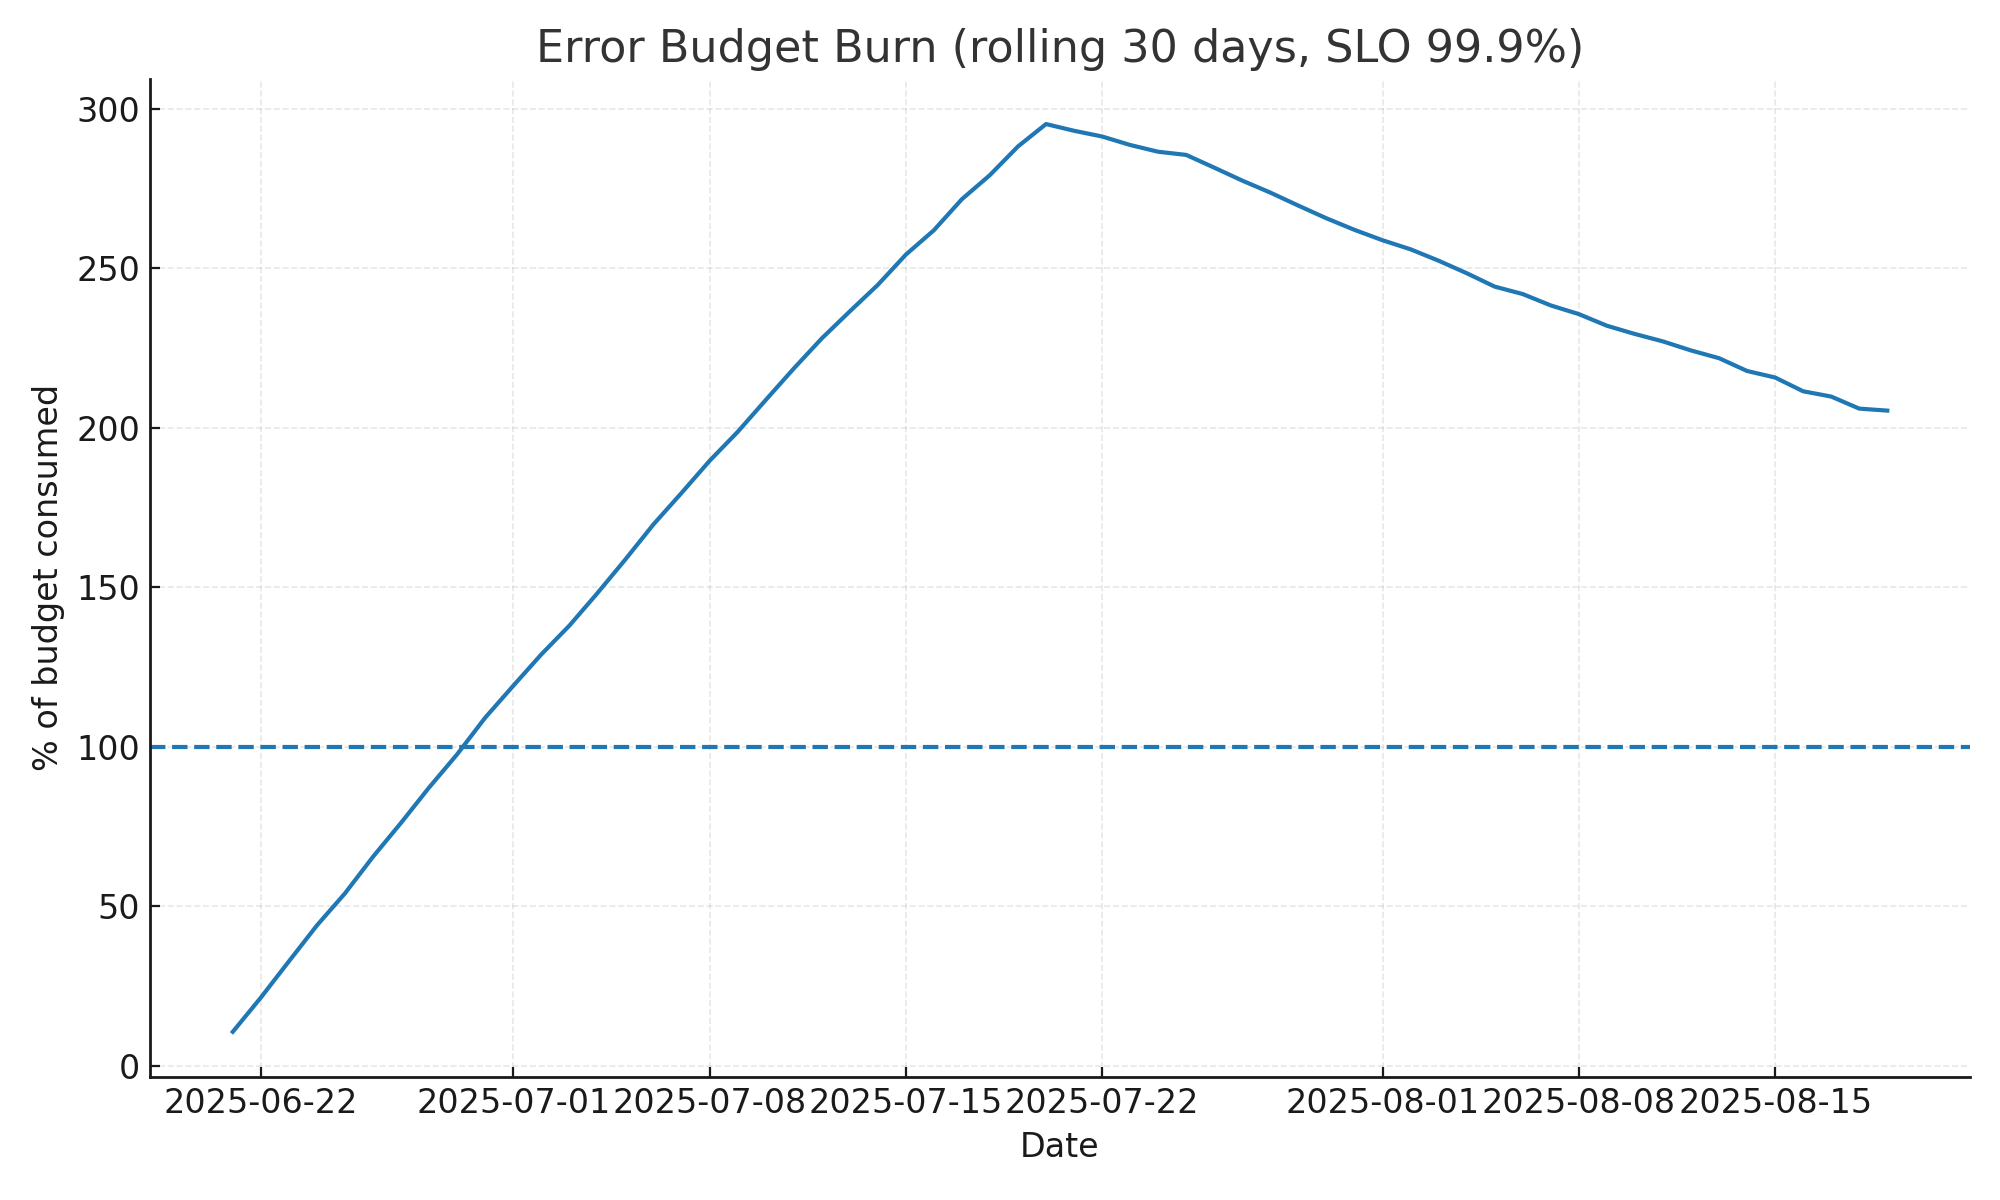
Error-budget burn (30-day): < 100%
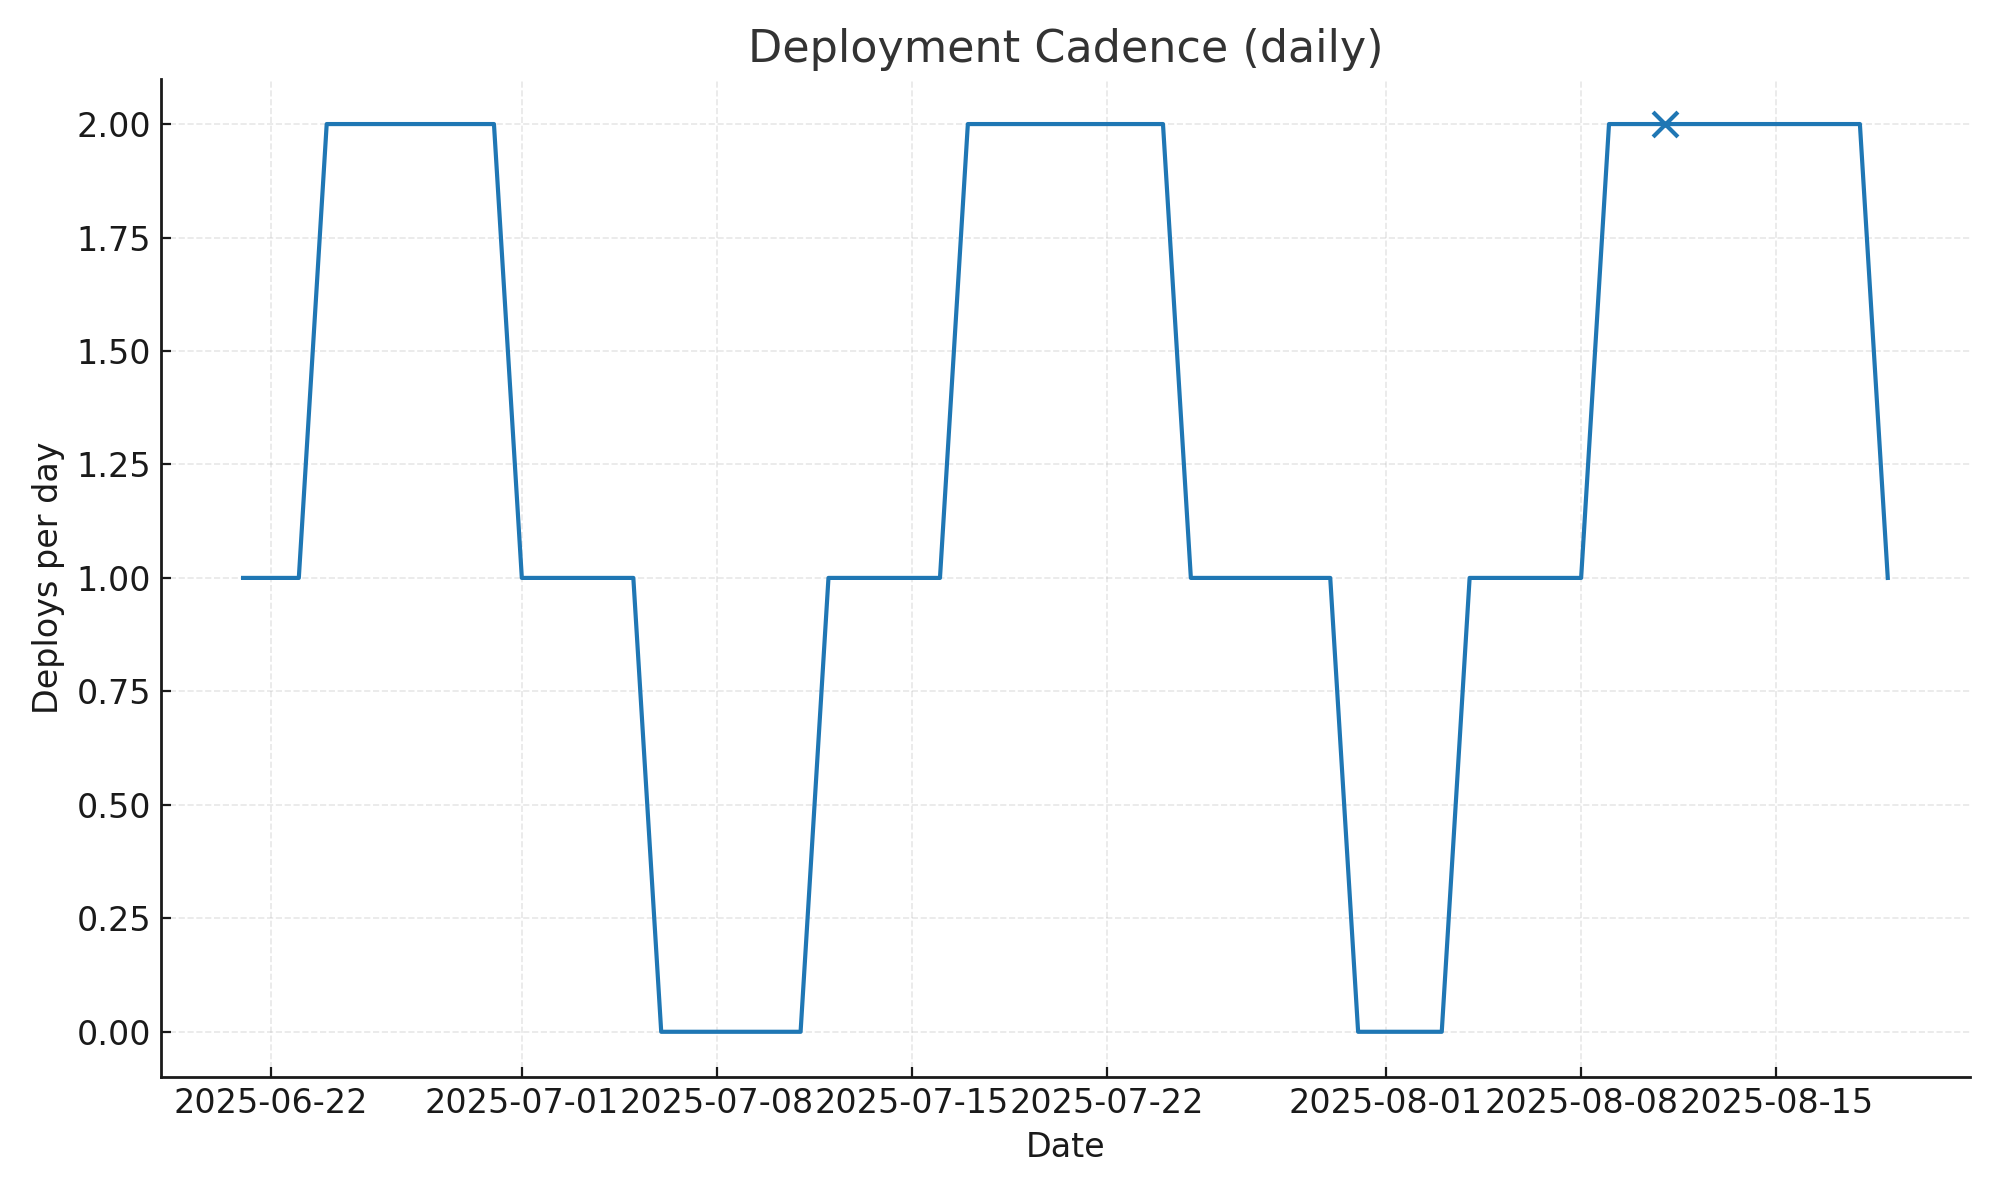
Deployment cadence — deploys/day; x marks days with failures
3. Final result
- Zero-downtime proven in prod cutover (0 s in canary window; ALB 5xx = 0).
- Rollback consistently ≤ 120 s, documented and drilled.
- Performance and cost within guardrails (P95 ≤ 250 ms; ≤ AU$2k/mo).
- Decision: platform accepted; runbook and rollback playbook handed over.
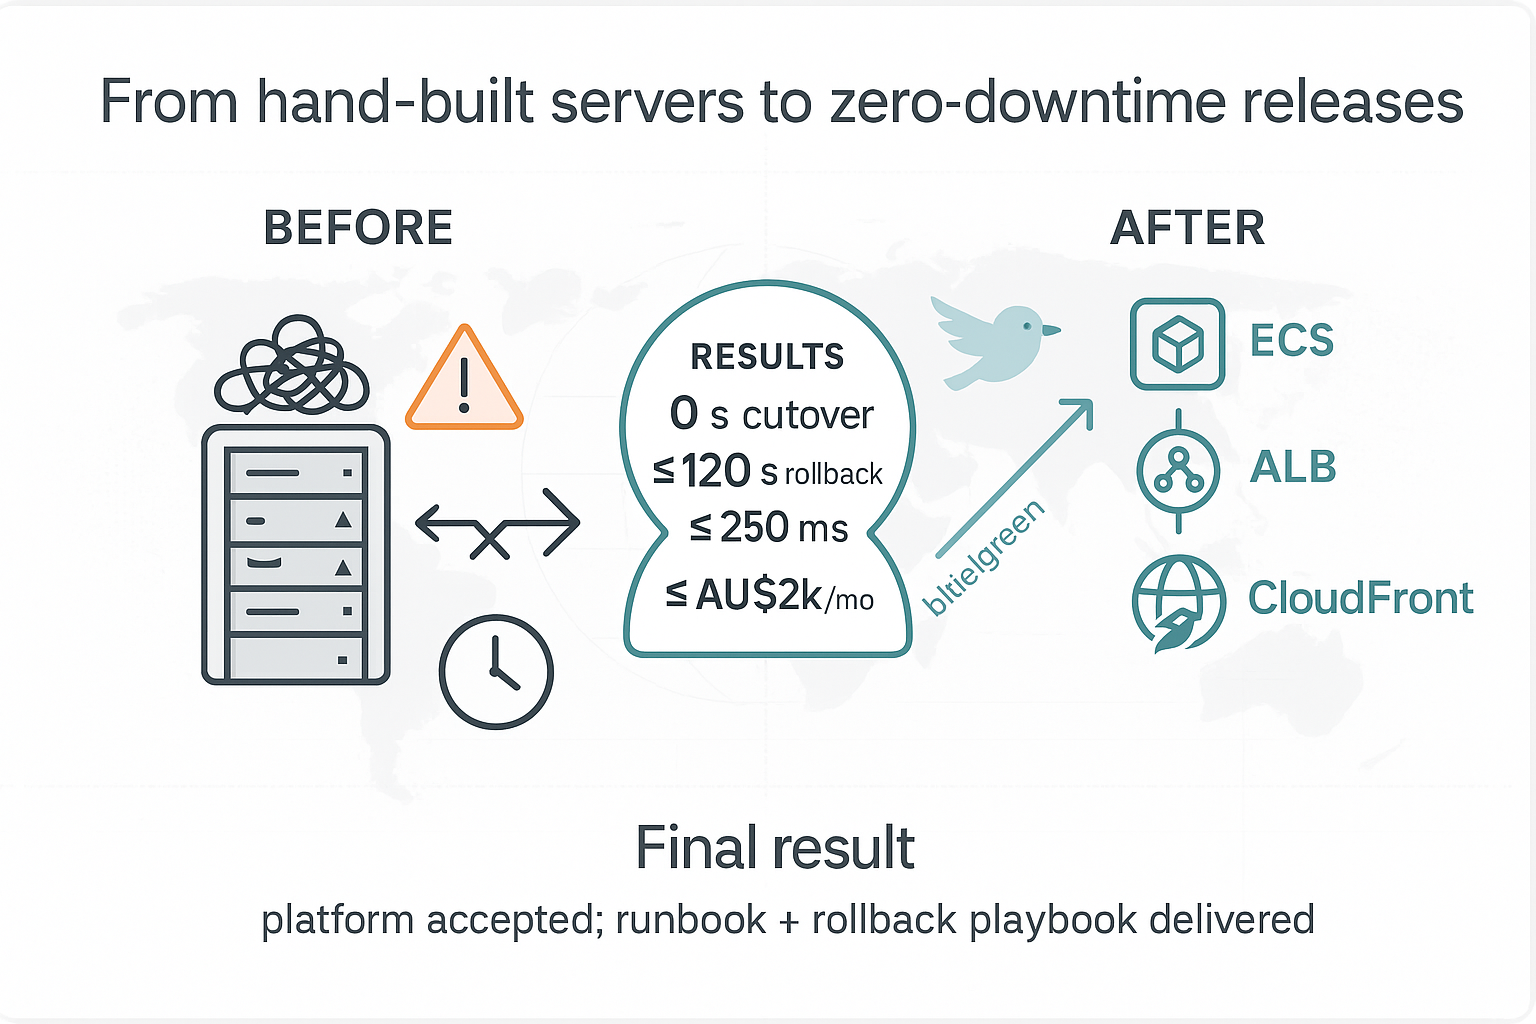
From hand‑built servers to a zero‑downtime release platform — 0 s cutover; rollback ≤ 120 s; P95 ≤ 250 ms; ≤ AU$2k/mo.
4. Summary
This project replaced a brittle VM setup with an AWS‑native, test‑first release platform. Evidence shows 0 s cutover downtime, ≤ 120 s rollbacks, P95 latency ≤ 250 ms at the edge, and monthly spend ≤ AU$2k. The runbook and rollback playbook are delivered; the platform is ready for routine releases without night‑time firefighting.